
Type:
Author:
Sort:
Research Papers
Jun 4, 2026
Policy Regimes versus Economic Regimes
Policy regimes do not map cleanly to economic outcomes, but many historical episodes have shades of similarity that can help to analyze regimes and build more resilient portfolios. Policy impacts the economy, but policy regimes and economic regimes are not interchangeable. The dictates of policy often sound like clean breaks, while economic realities blur across the boundaries. Luckily, this ambiguity can be an advantage. Instead of treating policy regimes like the zero interest rate policy (ZIRP) ...
Apr 15, 2026
The Fallacy of Concentration
Evidence shows that concentrated market capitalization weights do not make an index riskier, because larger stocks are inherently more diversified and their increased weights are offset by their lower volatility compared to small stocks. The dominance of large tech firms in market-cap-weighted indices has sparked recent concern about concentration risk, but historical data and empirical analysis suggest these fears may be unfounded. A review of nearly 90 years of market performance shows that ...
Apr 2, 2026
Permanent Capital Meets Private Markets
We analyse the transformative impact of life insurance platform integration on the business models, financial profiles, and market valuations of prominent alternative asset managers (AAMs). Relying on episodic fundraising through closed-end funds has long defined the growth and operating model of alternative asset managers (AAMs). Many firms have depended on periodic capital commitments from institutional investors, which, while effective for scaling private equity and credit strategies, expose ...

Jan 22, 2026
The Economic Logic of Large Language Models
We show that LLMs can effectively extrapolate from disparate domains of knowledge to reason through economic relationships, and that this may have advantages over narrower statistical models. Fundamentally, large language models (LLMs) and numerical models both learn patterns in training data. However, while traditional models rely on narrowly curated datasets, LLMs can extrapolate patterns across disparate domains of knowledge. In new research, we explore whether this ability is valuable for ...

Nov 5, 2025
Navigating the Green Tightrope
By Alexander Cheema-Fox, Megan Czasonis, Piyush Kontu, and George Serafeim We investigate reliance on carbon offsets for decarbonization, associated risks, and factors that explain variation in offset prices. Relying on carbon offsets for decarbonization has become an increasingly contentious approach in the fight against climate change. Many companies view the purchase of credits in carbon reduction or removal projects, such as reforestation or renewable energy initiatives, as an effective ...

Oct 9, 2025
A Transparent Alternative to Neural Networks
By Megan Czasonis, Mark Kritzman and David Turkington We show that relevance-based prediction captures complex relationships, like a neural network, but with the added benefit of transparency. Many prediction tasks in economics and finance lie beyond the reach of linear regression analysis. Researchers, therefore, often turn to machine learning techniques, such as neural networks, to address these complex dynamics. A neural network has the potential to extract nearly all the useful information ...
Sep 16, 2025
The Power of Narrative Attention
By Zachary Crowell, Lee Ferridge, Michael Guidi, William Kinlaw, Gideon Ozik, and Ronnie Sadka We present new research analyzing how media-driven narratives significantly influence currency movements, offering predictive power beyond traditional economic factors. We introduce a novel framework for quantifying how media attention to economic and geopolitical narratives impacts currency risk and returns. By analyzing nearly a decade of digital media across 52 currency pairs, we observe that sudden ...
Sep 4, 2025
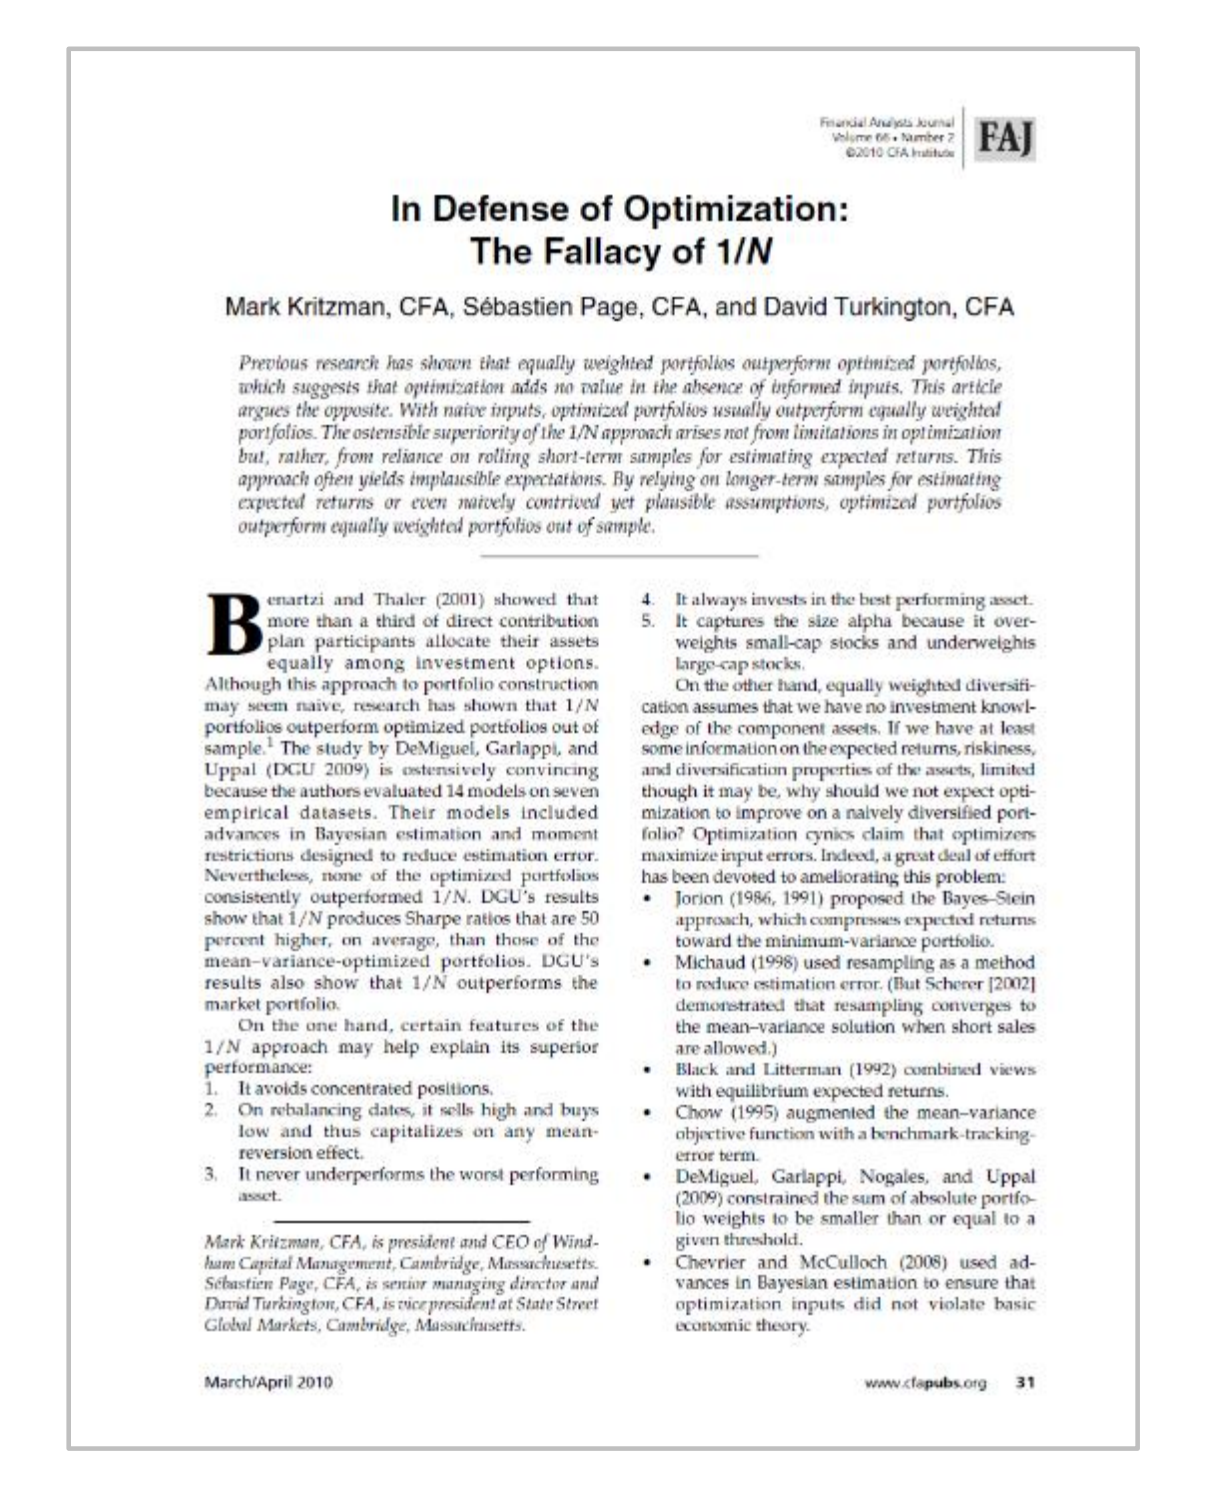
In Defense of Optimization
By Mark Kritzman, Sébastien Page, and David Turkington Our 2010 research paper – recently flagged by the Financial Analysts Journal as among the 23 most influential articles in its 80 year history—defended how data-drive portfolio optimization adds value when it is thoughtfully applied. Investors rarely aspire to mediocrity, yet critics love to dismiss the quest for an “optimal” portfolio as quixotic. In an article published in the Financial Analysts Journal 15 years ago, we challenged the ...
Jul 23, 2025
Relevance-Based Importance
By Megan Czasonis, Mark Kritzman, and David Turkington As the race to design sophisticated data analytics continues, we show why relevance-based prediction offers an ideal way to measure the importance of an input variable to a prediction. T-statistics act as a hallmark for rigor by pinpointing the effect of a single variable and distinguishing signal from noise. However, they have significant limitations: (1) t-stats do not capture ‘shared’ information, (2) t-stats are not prediction-specific, ...
May 22, 2025
Bridging Academia and Practice
Fresh off his 2025 James R. Vertin Award win, State Street Associates’ Founding Partner Mark Kritzman joins David Turkington, head of State Street Associates, for a discussion on the key themes that have underpinned Mark’s body of research, the importance of connecting research with intellectual curiosity, and the key qualities of research that can stand the test of time.

Apr 30, 2025
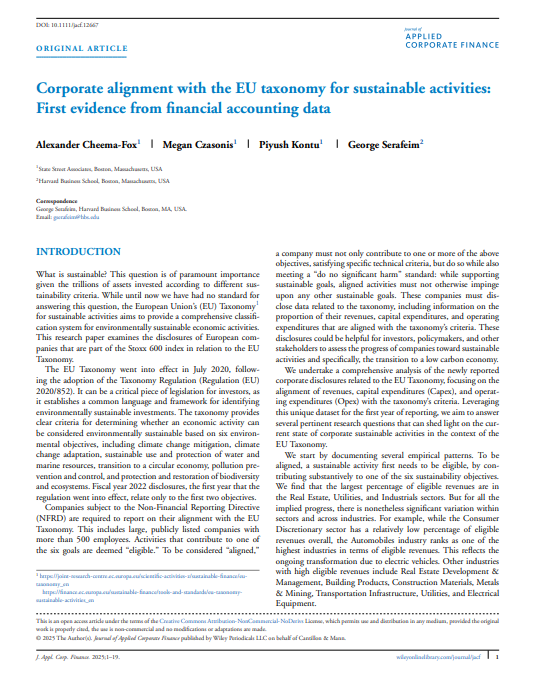
Corporate Alignment with the EU Taxonomy
By Alexander Cheema-Fox, Megan Czasonis, Piyush Kontu and George Serafeim We explore the world’s first set of financial accounting data on firms’ sustainable activities. Though sustainable investing has grown in popularity over the past decade, measuring sustainability remains a key challenge. Investors often rely on environmental criteria—such as analyst ratings and carbon emissions—that are insufficient or rely on qualitative analysis. However, for the first time, with the advent of the EU’s ...
Apr 9, 2025
The Virtue of Transparency for Prediction
By Megan Czasonis, Mark Kritzman and David Turkington We show how our method of relevance-based prediction implements similar logic to a highly complex machine learning model, but relevance is extremely transparent. What is the best way to form predictions from a data sample? This is a big question, but at its core lies a fundamental tension between explaining the past and anticipating the future. Predictions can fail by paying too little attention to the past (underfitting) or by paying too ...
Mar 19, 2025
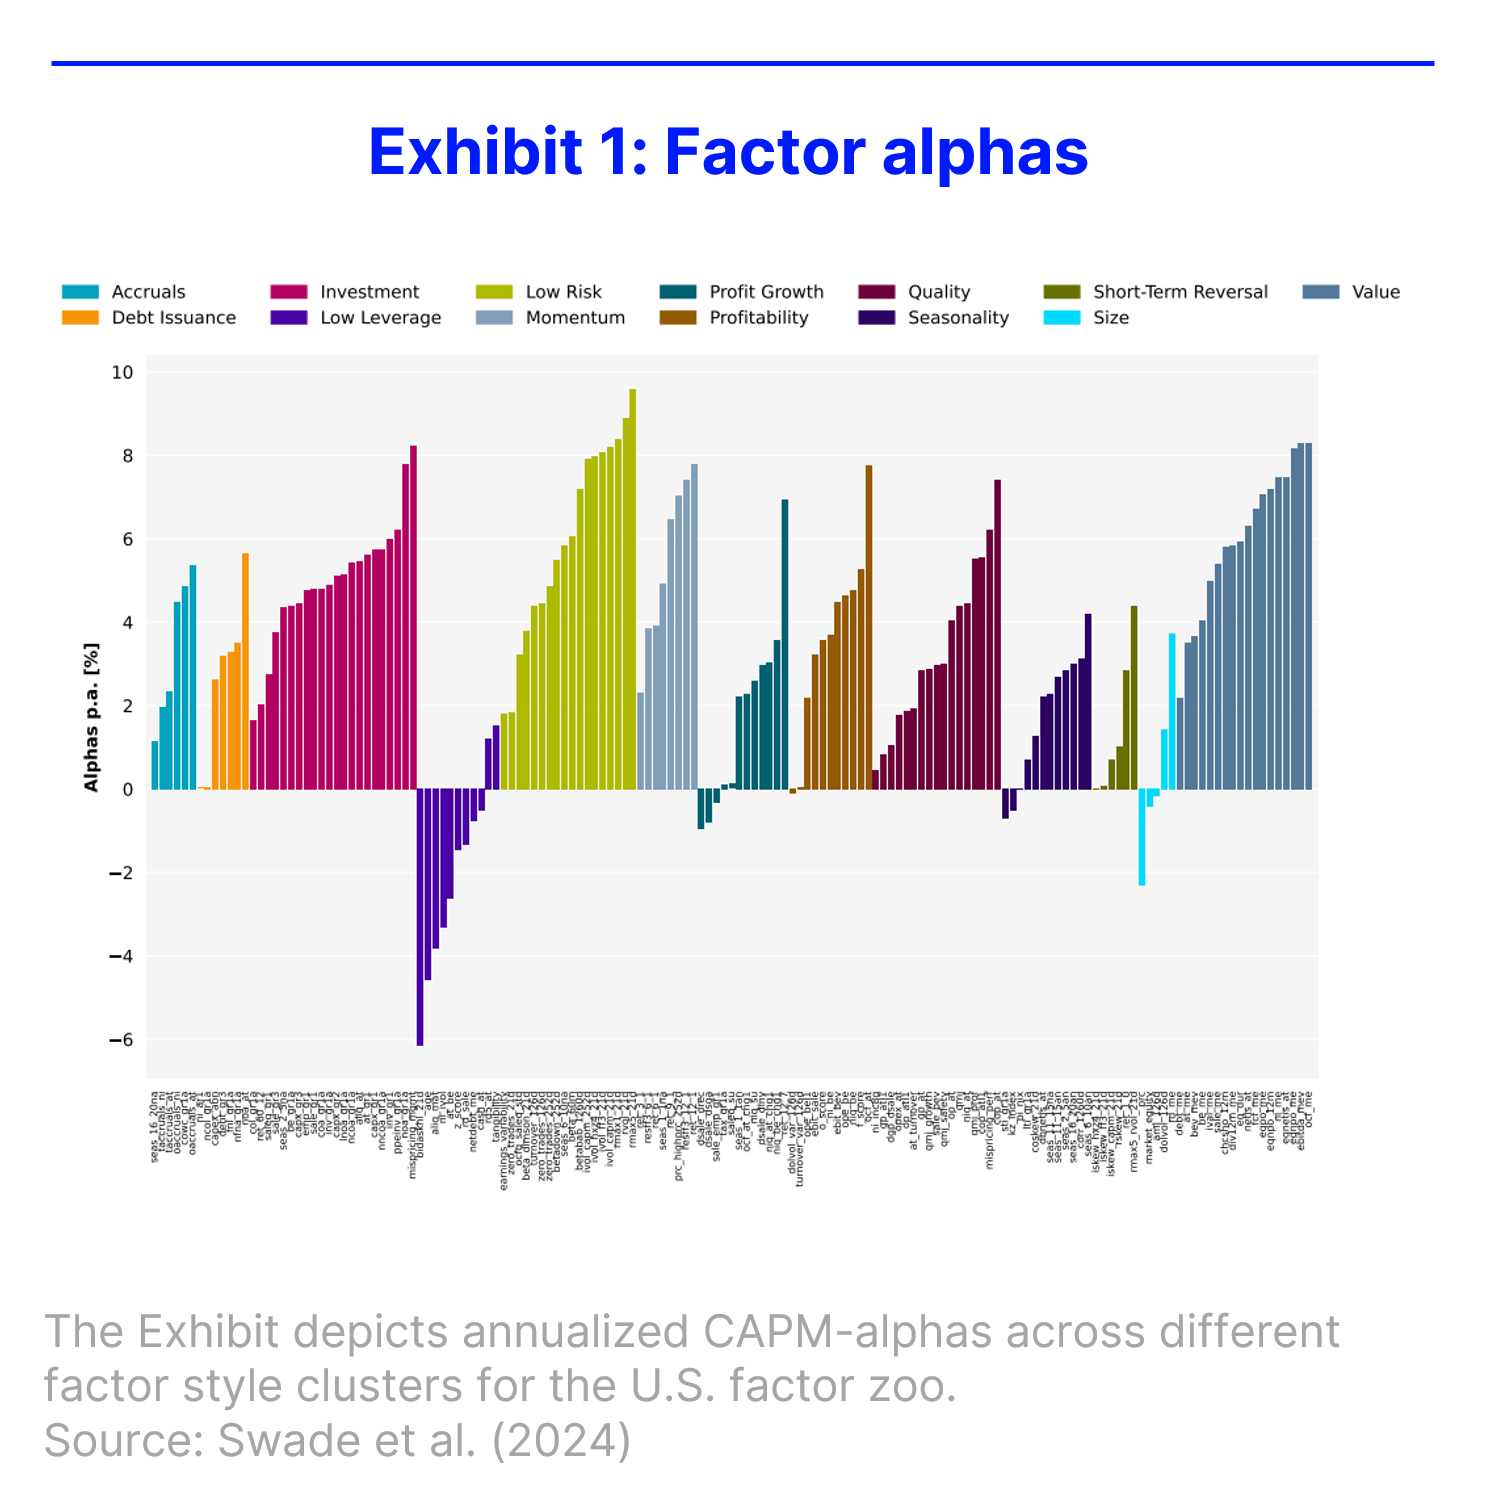
Factor Zoo (.zip)
By Alexander Swade, Matthias X. Hanauer, Harald Lohre, and David Blitz The authors propose a straightforward yet effective method to identify the factors that capture most of the available "alpha". Since the introduction of the Capital Asset Pricing Model (CAPM), researchers have been on a quest to find the most important factors, leading to a crowded "factor zoo." Despite the variety of these factors, academic models suggested for years that most of them can be boiled down to just four to six ...
Nov 6, 2024
Co-Occurrence: A New Perspective on Diversification
By William Kinlaw, Mark Kritzman, and David Turkington Conventional statistics hide important realities that investors need to know. The correlation coefficient often fails to capture what really matters to investors. There are two reasons for this. First, investors often measure correlations using monthly data and assume that they also hold over one-year, five-year or ten-year periods. Unfortunately, in the real world, they often don’t. The second reason has to do with a fundamental misconception ...

Oct 24, 2024
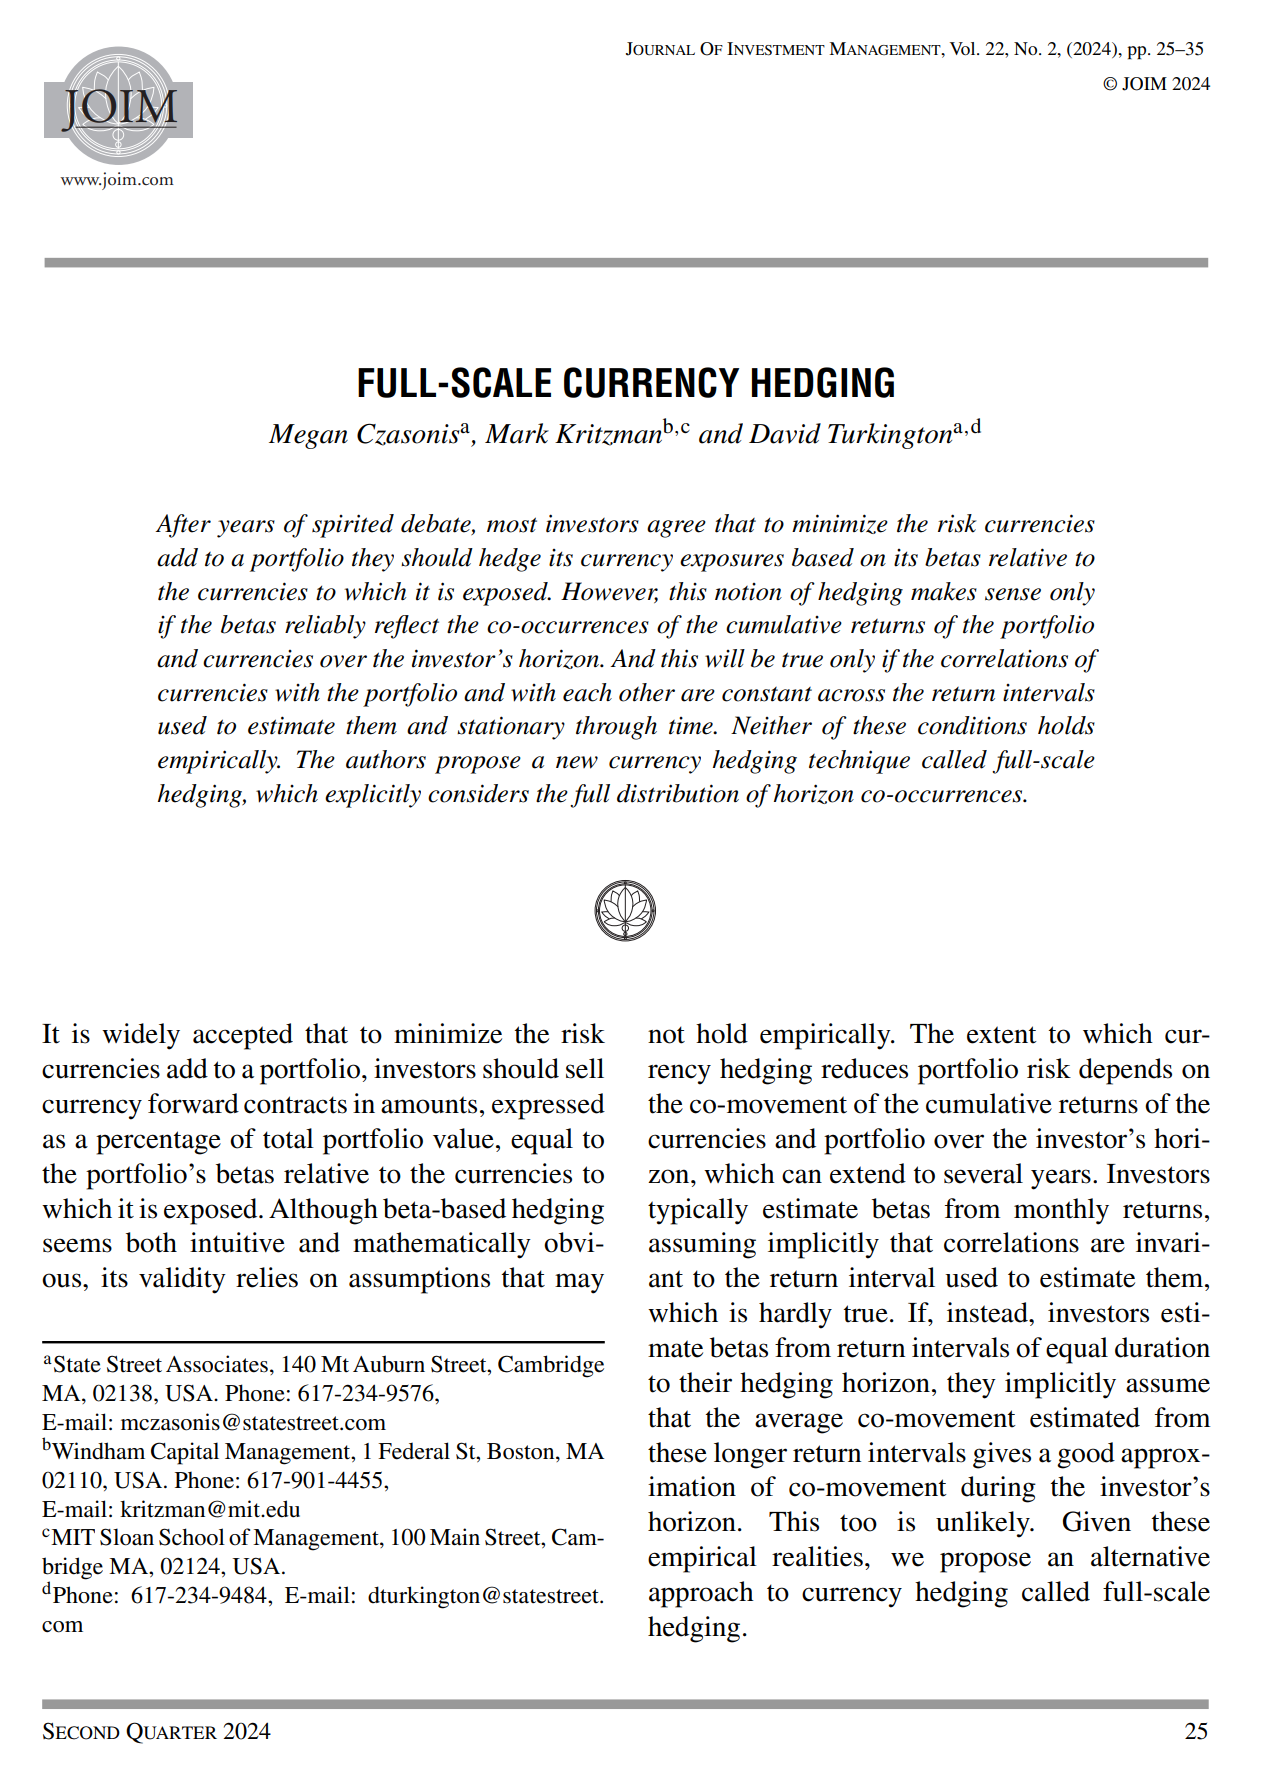
Full-Scale Currency Hedging
By Megan Czasonis, Mark Kritzman, and David Turkington We propose a new currency hedging technique called full-scale hedging, which accounts for the complexities of diversification. Diversification is nuanced and summary statistics, such as correlation, fail to capture complexities that lie below the surface. For investors, these complexities matter—accounting for them can make the difference between an effective, or ineffective, hedging strategy. In the case of currencies, investors often determine ...
Mar 14, 2024
Dynamic Warp Analysis: A New Approach for Detecting and Timing Bubbles
By Megan Czasonis, Mark Kritzman, and David Turkington We show how our method of relevance-based prediction implements similar logic to a highly complex machine learning model, but relevance is extremely transparent. What is the best way to form predictions from a data sample? This is a big question, but at its core lies a fundamental tension between explaining the past and anticipating the future. Predictions can fail by paying too little attention to the past (underfitting) or by paying too ...
Nov 20, 2023
Portfolio Construction When Regimes Are Ambiguous
By Mark Kritzman, Cel Kulasekaran, and David Turkington. We introduce a more flexible way to forecast risk and return based on the most relevant historical periods. As economic regimes shift, investors who choose to adapt must build portfolios that match their evolving view of the future. Forecasts of asset risk and return should account for regime-specific trends. The question is how to implement this idea in practice. Typically, an analyst will find every time an economic indicator like inflation ...

Oct 26, 2023
Inflation Hedging: A Dynamic Approach Using Online Prices
By Alberto Cavallo, Megan Czasonis, William Kinlaw, and David Turkington We show how unstructured price data from online retailers can anticipate inflation shifts and enable investors to hedge inflation risk dynamically. Investors and academics have been studying inflation, and how it affects asset prices, for more than four decades. Their findings are discouraging: there just aren’t many assets that offer a reliable hedge against inflation. Treasury Inflation Protected Securities (TIPS), ...
Oct 17, 2023
Fed Members’ Monetary Tones and Yields
By Musa Amadeus, Rajeev Bhargava, Michael Guidi, Marvin Loh, Gideon Ozik, and Ronnie Sadka Read between the lines: The measurement of Fed members’ monetary tones facilitates an understanding of the dynamics of the individual monetary policy stances underlying aggregated, consensus (top-down) Fed tones. Amadeus et al. (2022) observe that aggregated, consensus (top-down) central bank monetary tones in media contain predictive information pertaining to future weekly yield fluctuations. This article ...
Sep 7, 2023
An Intuitive Guide to Relevance-Based Prediction
By Megan Czasonis, Mark Kritzman, and David Turkington Relevance-based prediction is a new approach to data-driven forecasting that serves as a favorable alternative to both linear regression analysis and machine learning. It follows from two seminal scientific innovations: Prasanta Mahalanobis’ distance measure and Claude Shannon’s information theory. Relevance-based prediction rests on three key tenets: 1) relevance, which measures the importance of an observation to a prediction; 2) fit, ...
Sep 5, 2023
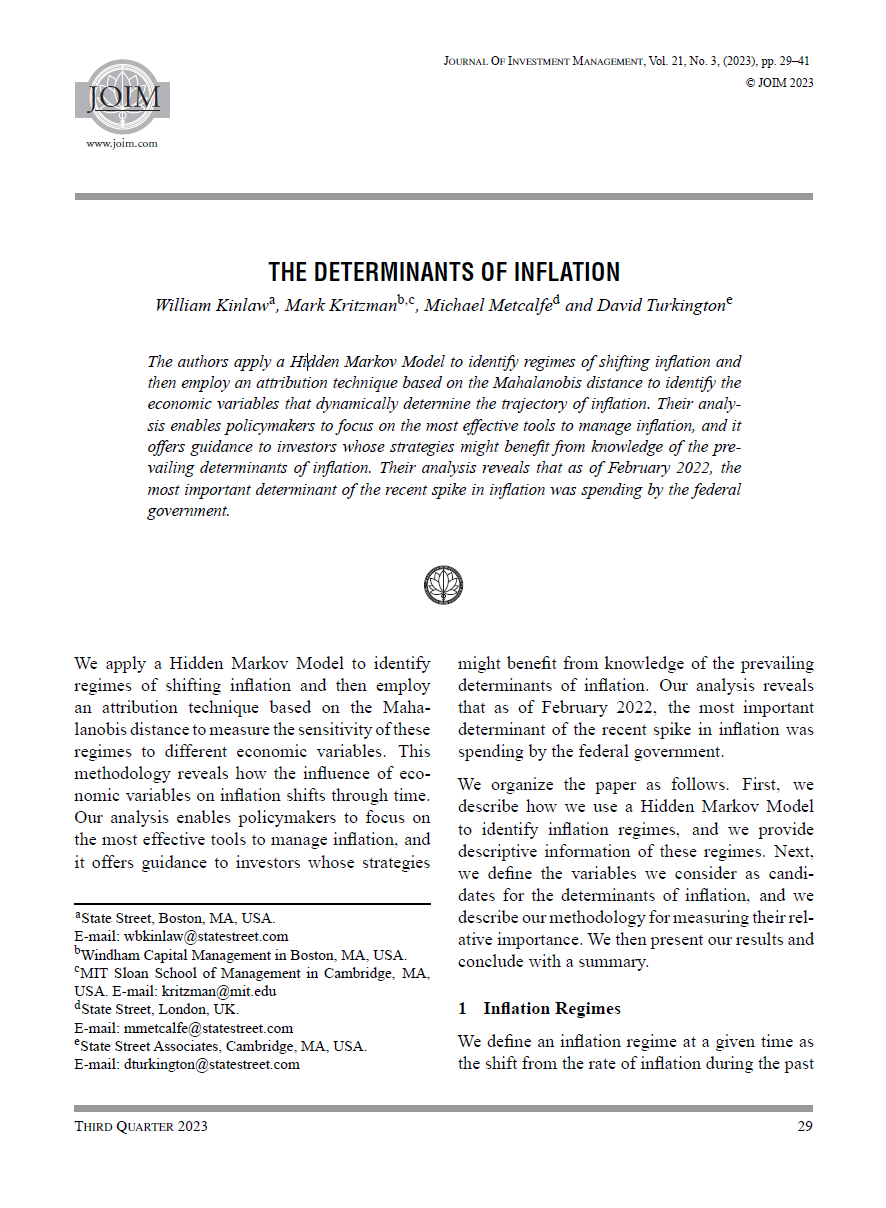
The Determinants of Inflation
By William Kinlaw, Mark Kritzman, Michael Metcalfe, and David Turkington Published in the Journal of Investment Management, Third Quarter 2023 and recipient of the 2023 Harry Markowitz Award. We use novel statistical techniques to measure the time-varying influence of cost push, demand pull, inflation expectations, monetary policy, and fiscal policy on inflation regimes. It can be hard to pin down what causes inflation, and often a range of views are put forth. The shifting nature of inflation ...
May 25, 2023
Event Time
By Megan Czasonis, Mark Kritzman, and David Turkington We measure investment returns based on the passage of meaningful events rather than just counting the days. From a calendar perspective, every day or month is the same as any other day or month. However, from an event perspective, some periods are more meaningful than others. For example, we arguably experienced more in the Covid-induced upheaval of March 2020 than we do in most years. For investors, meaningful events are important, because ...

Apr 4, 2023
Quantifying Narratives and their Impact on Financial Markets
By Rajeev Bhargava, Xiaoxia Lou, Gideon Ozik, Ronnie Sadka and Travis Whitmore We introduce a unique media-based measure of narratives, called thematic indicators, and explore how they can be used to improve asset allocation and achieve desired thematic exposures. This paper introduces a media-coverage-based approach to quantify narratives and develops methodologies to explain the extent to which narratives drive financial markets and returns of investment portfolios. We show that media-derived ...

Mar 13, 2023
Stock Vulnerability and Resilience
By Megan Czasonis, Huili Song, and David Turkington We use a statistical method that combines a stock’s attributes in a nonlinear and conditional way in order to predict its relative vulnerability or resilience to market drawdowns. By definition, a stock market crash corresponds to a severe, market-wide drawdown. However, below the surface, there is often considerable dispersion in the performance of individual stocks during these events. In a recent paper, we explore whether a stock’s unique ...
Feb 28, 2023
Climate Solutions Investments
By Alexander Cheema-Fox, George Serafeim, and Hui (Stacie) Wang Beyond carbon avoidance. A look at investing in firms with “pure-play” climate solutions. An increasing number of companies are providing products and services that help reduce carbon emissions in the economy. We develop a methodology to identify “pure-play” climate solutions companies and construct portfolios from these companies. Our analysis reveals several insights. First, emerging markets have a significant presence in our ...

Dec 21, 2022
Relevance-Based Prediction
By Megan Czasonis, Mark Kritzman, and David Turkington Published in the Journal of Financial Data Science, Winter 2023, and recipient of the 2023 Roger F. Murray First Place Prize Award. Statistics and intuition converge with the concept of “relevance”. We introduce a prediction system based on assessing the relevance of prior outcomes for future predictions, and describe the advantage it brings to both simple and complex quant models. It is hard to make good predictions about the future, ...
Sep 15, 2022
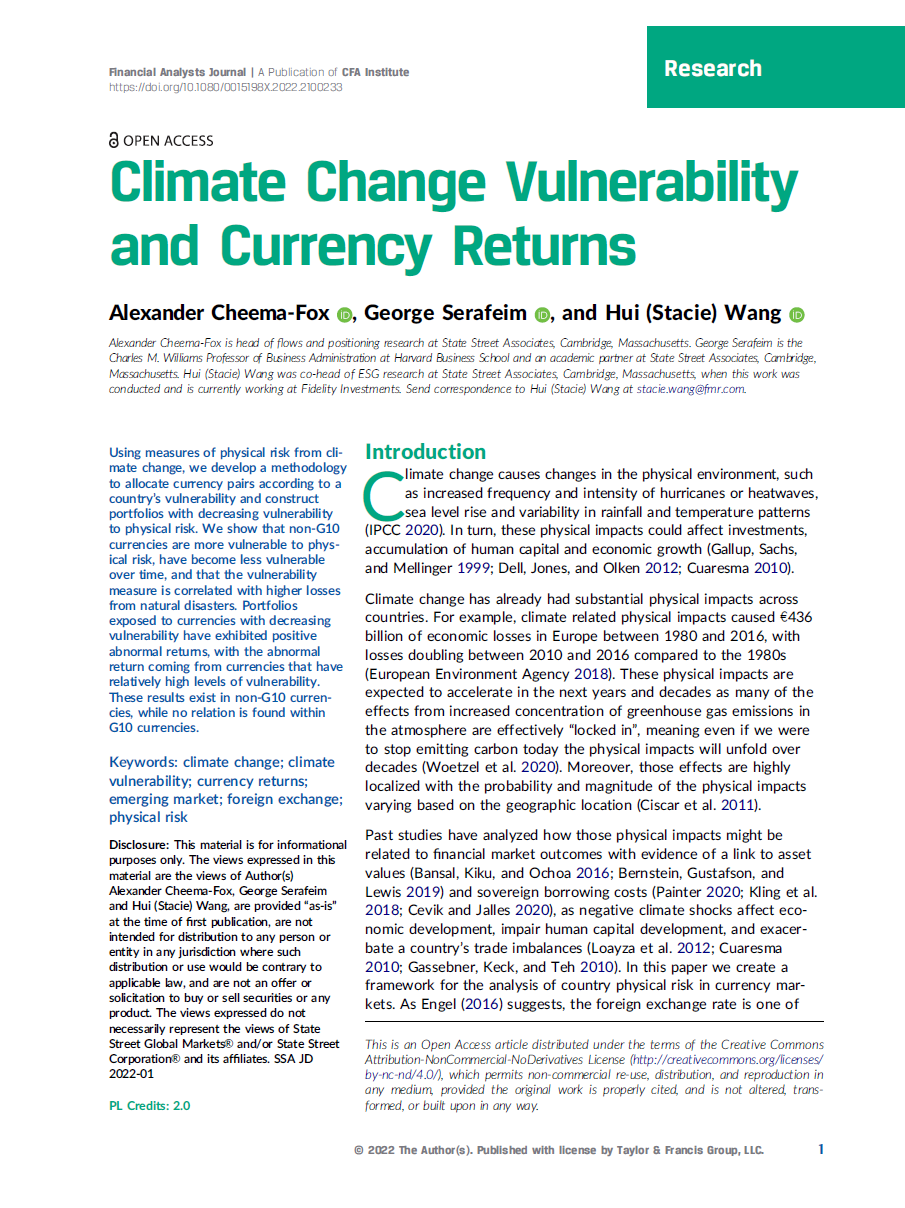
Climate Change Vulnerability and Currency Returns
By Alexander Cheema-Fox, George Serafeim, and Hui (Stacie) Wang. Substantial physical impacts from climate change are already happening around the world and are expected to accelerate in the next few decades. Using measures of physical risk from climate change, we develop a methodology to allocate currency pairs according to a country’s vulnerability to climate change. In turn, we use this to demonstrate how investors can construct portfolios with decreasing vulnerability to physical risk. During ...
Mar 30, 2022
Central Bank Monetary Tones and Yields
By Musa Amadeus, Rajeev Bhargava, Timothy Graf, Michael Guidi, Michael Metcalfe, Gideon Ozik, and Ronnie Sadka Published in the Journal of Fixed Income, Spring 2022 Read between the lines: Central bank monetary tones contain predictive information relating to weekly fluctuations in treasury yields. This paper examines the ramifications of central bank monetary tones on future changes in yields. We observe that monetary tones in media coverage of central bank policies contain predictive information ...
Mar 28, 2022
The Role of Cryptocurrencies in Investor Portfolios
By Megan Czasonis, Mark Kritzman, Baykan Pamir, and David Turkington. Published in the Journal of Alternative Investments, Spring 2022. What is the role and diversification potential of cryptocurrencies from a total portfolio perspective? Growth engine or diversifier? We explore the potential role of bitcoin in multi-asset portfolios based on their track record for diversifying stocks (or not) over the last nine years. We consider the various features of diversification: monthly versus multi-year ...
Mar 25, 2022
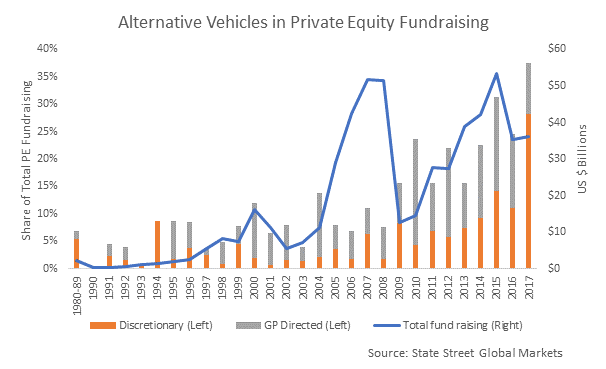
Investing Outside the Box: Evidence from Alternative Vehicles in Private Equity
By Josh Lerner, Jason Mao, Antionette Schoar, and Nan R. Zhang Published in the Journal of Financial Economics, January 2022. Contrary to common belief, returns in alternative vehicles in private equity increasingly depend on the match between GPs and LPs and both parties’ outside options. Using previously unexplored custodial data, we examine alternative investment vehicles (AVs) in private equity (PE) funds over the last four decades. By 2017, AVs reached 40% of all PE commitments. Average ...
1. Peter L. Bernstein Award for Best Article in an Institutional Investor Journal in 2013; Bernstein-Fabozzi/Jacobs-Levy Award for Outstanding Article in the Journal of Portfolio Management in 2006, 2009, 2011, 2013 (2), 2014, 2015, 2016, 2021; Graham & Dodd Scroll Award for article in the Financial Analysts Journal in 2002 and 2010. Roger F. Murray First Prize for Research Presented at the Q Group Conference in 2012, 2021, 2023. Harry M. Markowitz Award for Best Paper in the Journal of Investment Management in 2022, 2023. Doriot Award for Best Private Equity Research Paper in 2022.