


Our Indicators
Our position as one of the world’s largest custodians means we see how real money moves. We bring our clients a differentiated perspective on flow and positioning trends across asset classes.
When paired with other indicators such as daily inflation from State Street PriceStats, central-bank tone and narratives from MediaStats, and multi-dimensional measures of market fragility, that foundation becomes a practical, proprietary, and purpose built view of markets to help anticipate what may come next.
Institutional Behavior
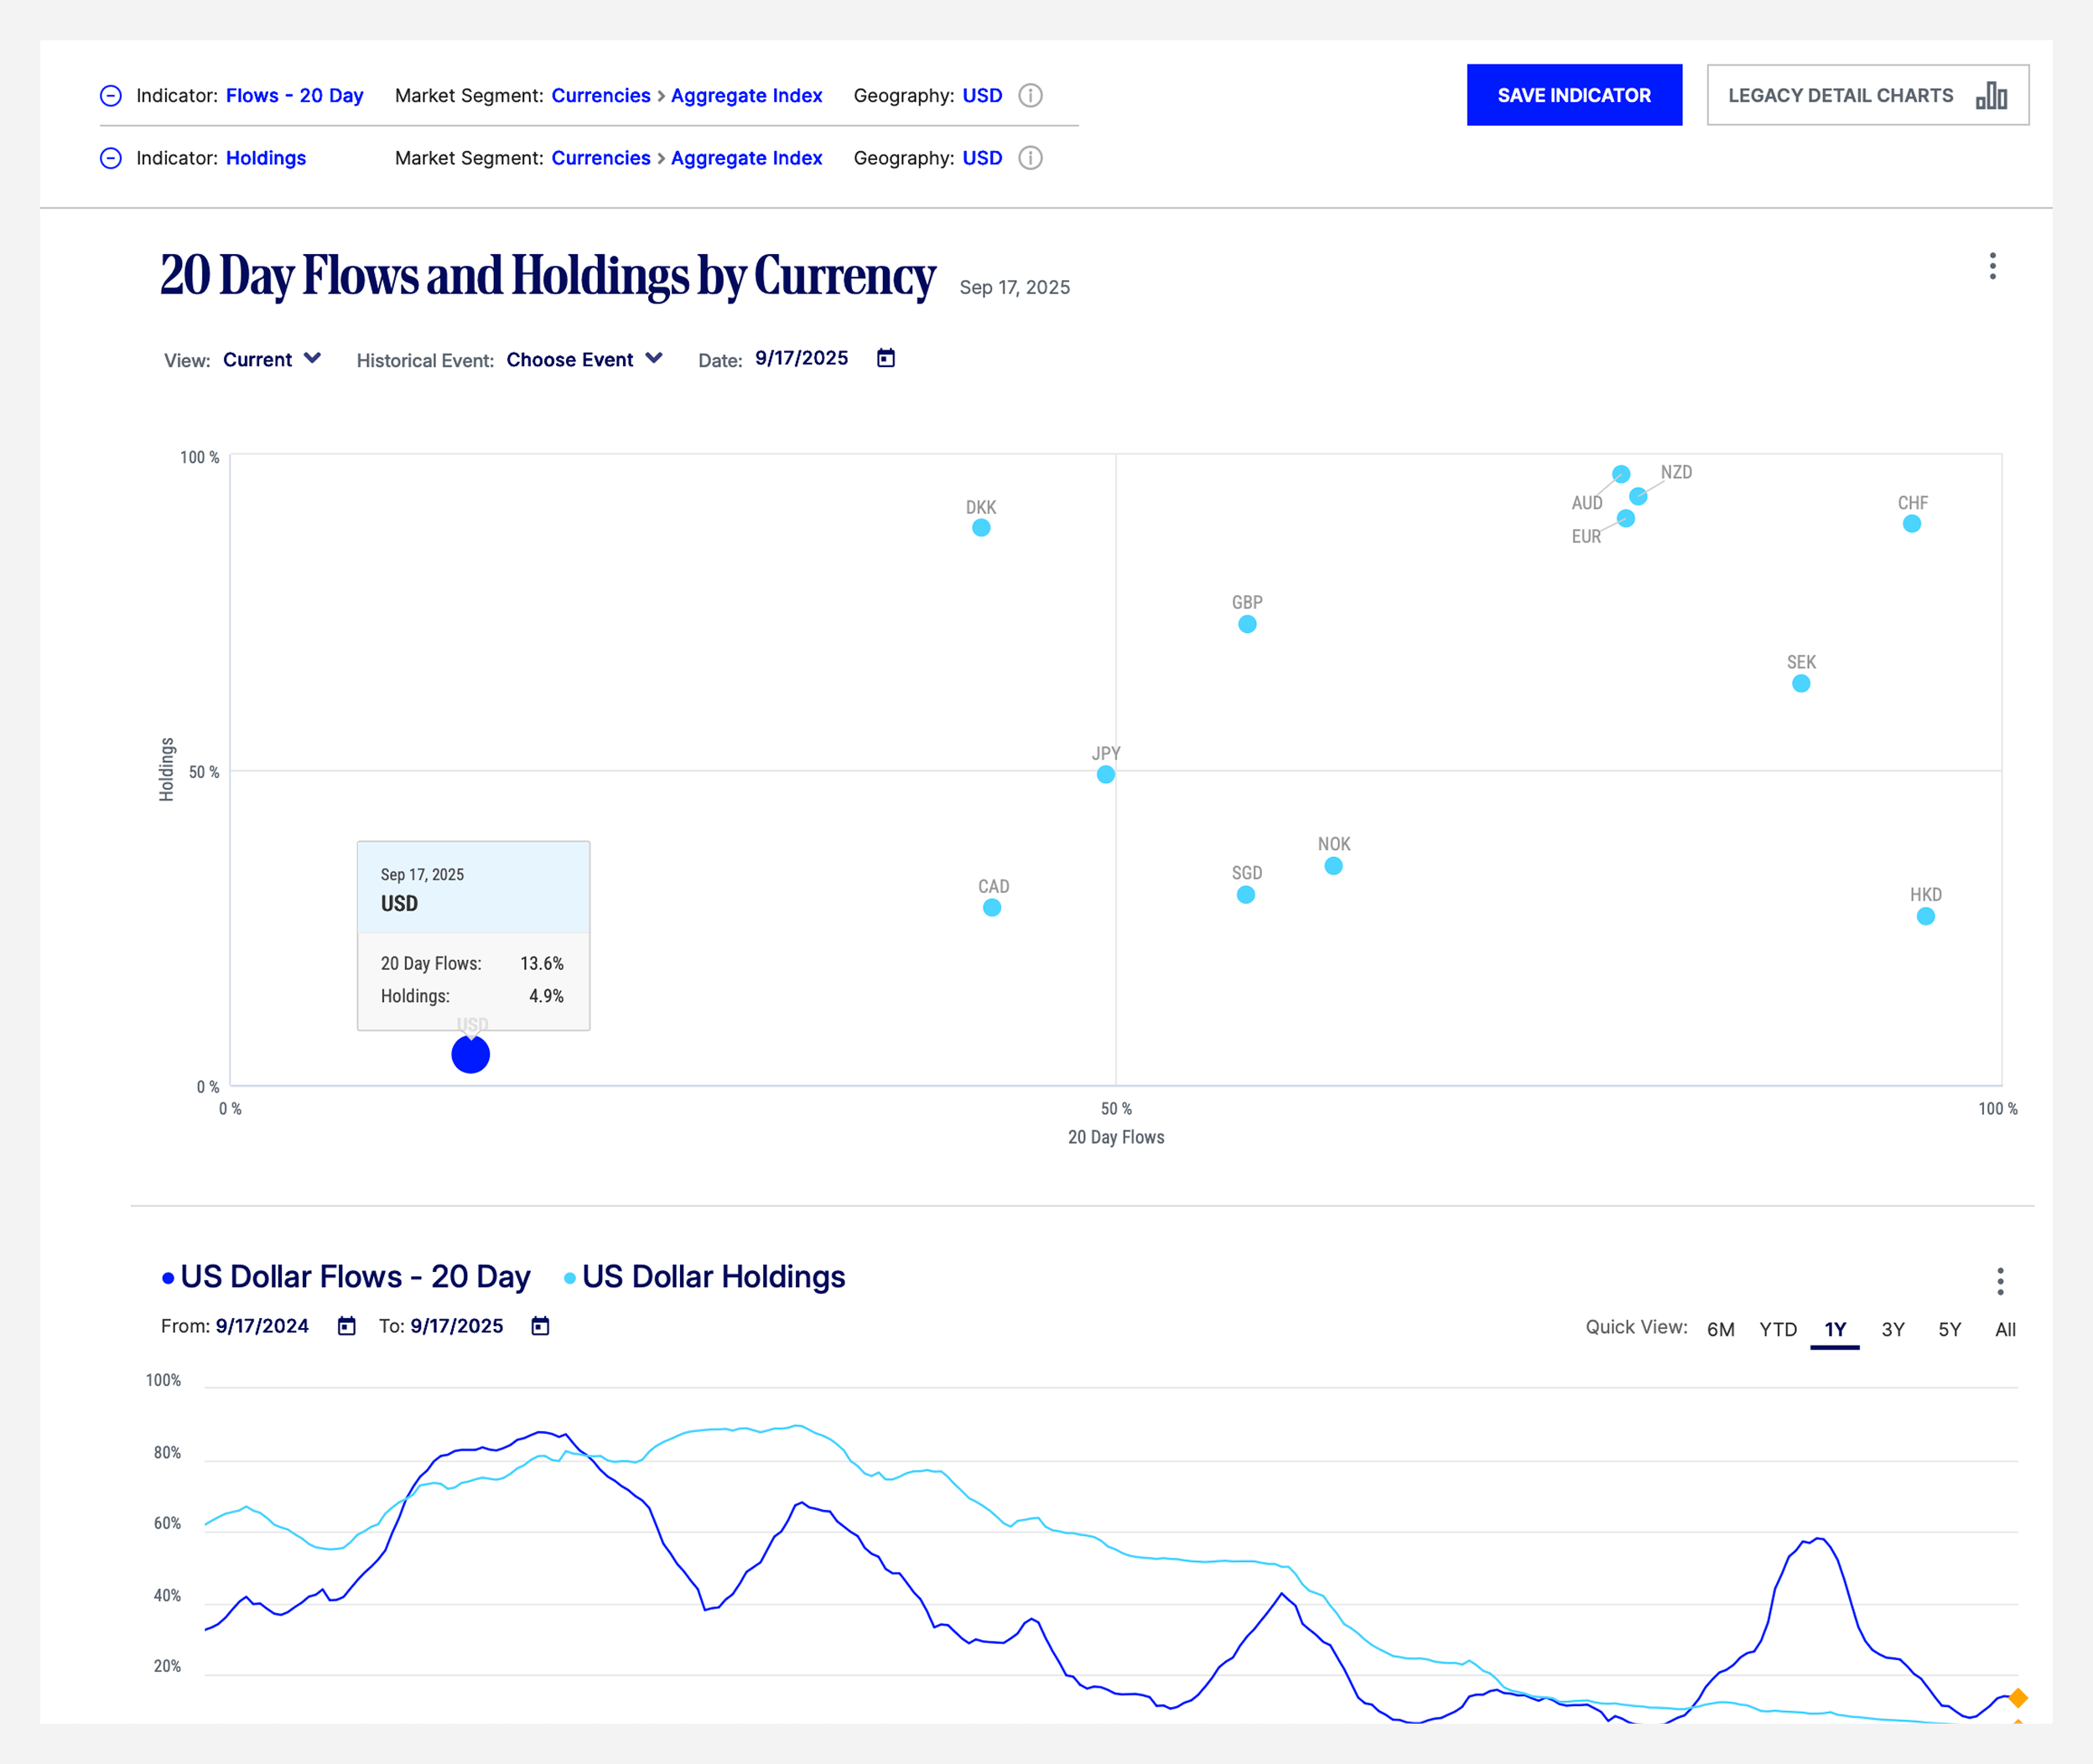
Powered by aggregated and anonymized information from our unique vantage point across markets, our behavioral suite of indicators highlights essential patterns in flows and positioning both across and within asset classes.
Demand and positioning across countries, sectors, currencies, bond markets, and the yield curve.
High-level institutional allocations across equities, bonds, and cash.
Synthesizes the pattern of investor demand across different risk trades to identify revealed sentiment.
Deep dives into how investors hedge currency risk across domiciles and asset classes.
Why it matters:
Flows exhibit persistence and price impact, which can enable them to be predictive of future returns, while holdings and hedge ratios flag crowded trades and amplify flow signals. Multifactor syntheses like the BRS reveal the broad-based picture of sentiment gleaned from patterns of flows across risky vs safe haven assets.
Flows exhibit persistence and price impact, which can enable them to be predictive of future returns, while holdings and hedge ratios flag crowded trades and amplify flow signals. Multifactor syntheses like the BRS reveal the broad-based picture of sentiment gleaned from patterns of flows across risky vs safe haven assets.
MediaStats
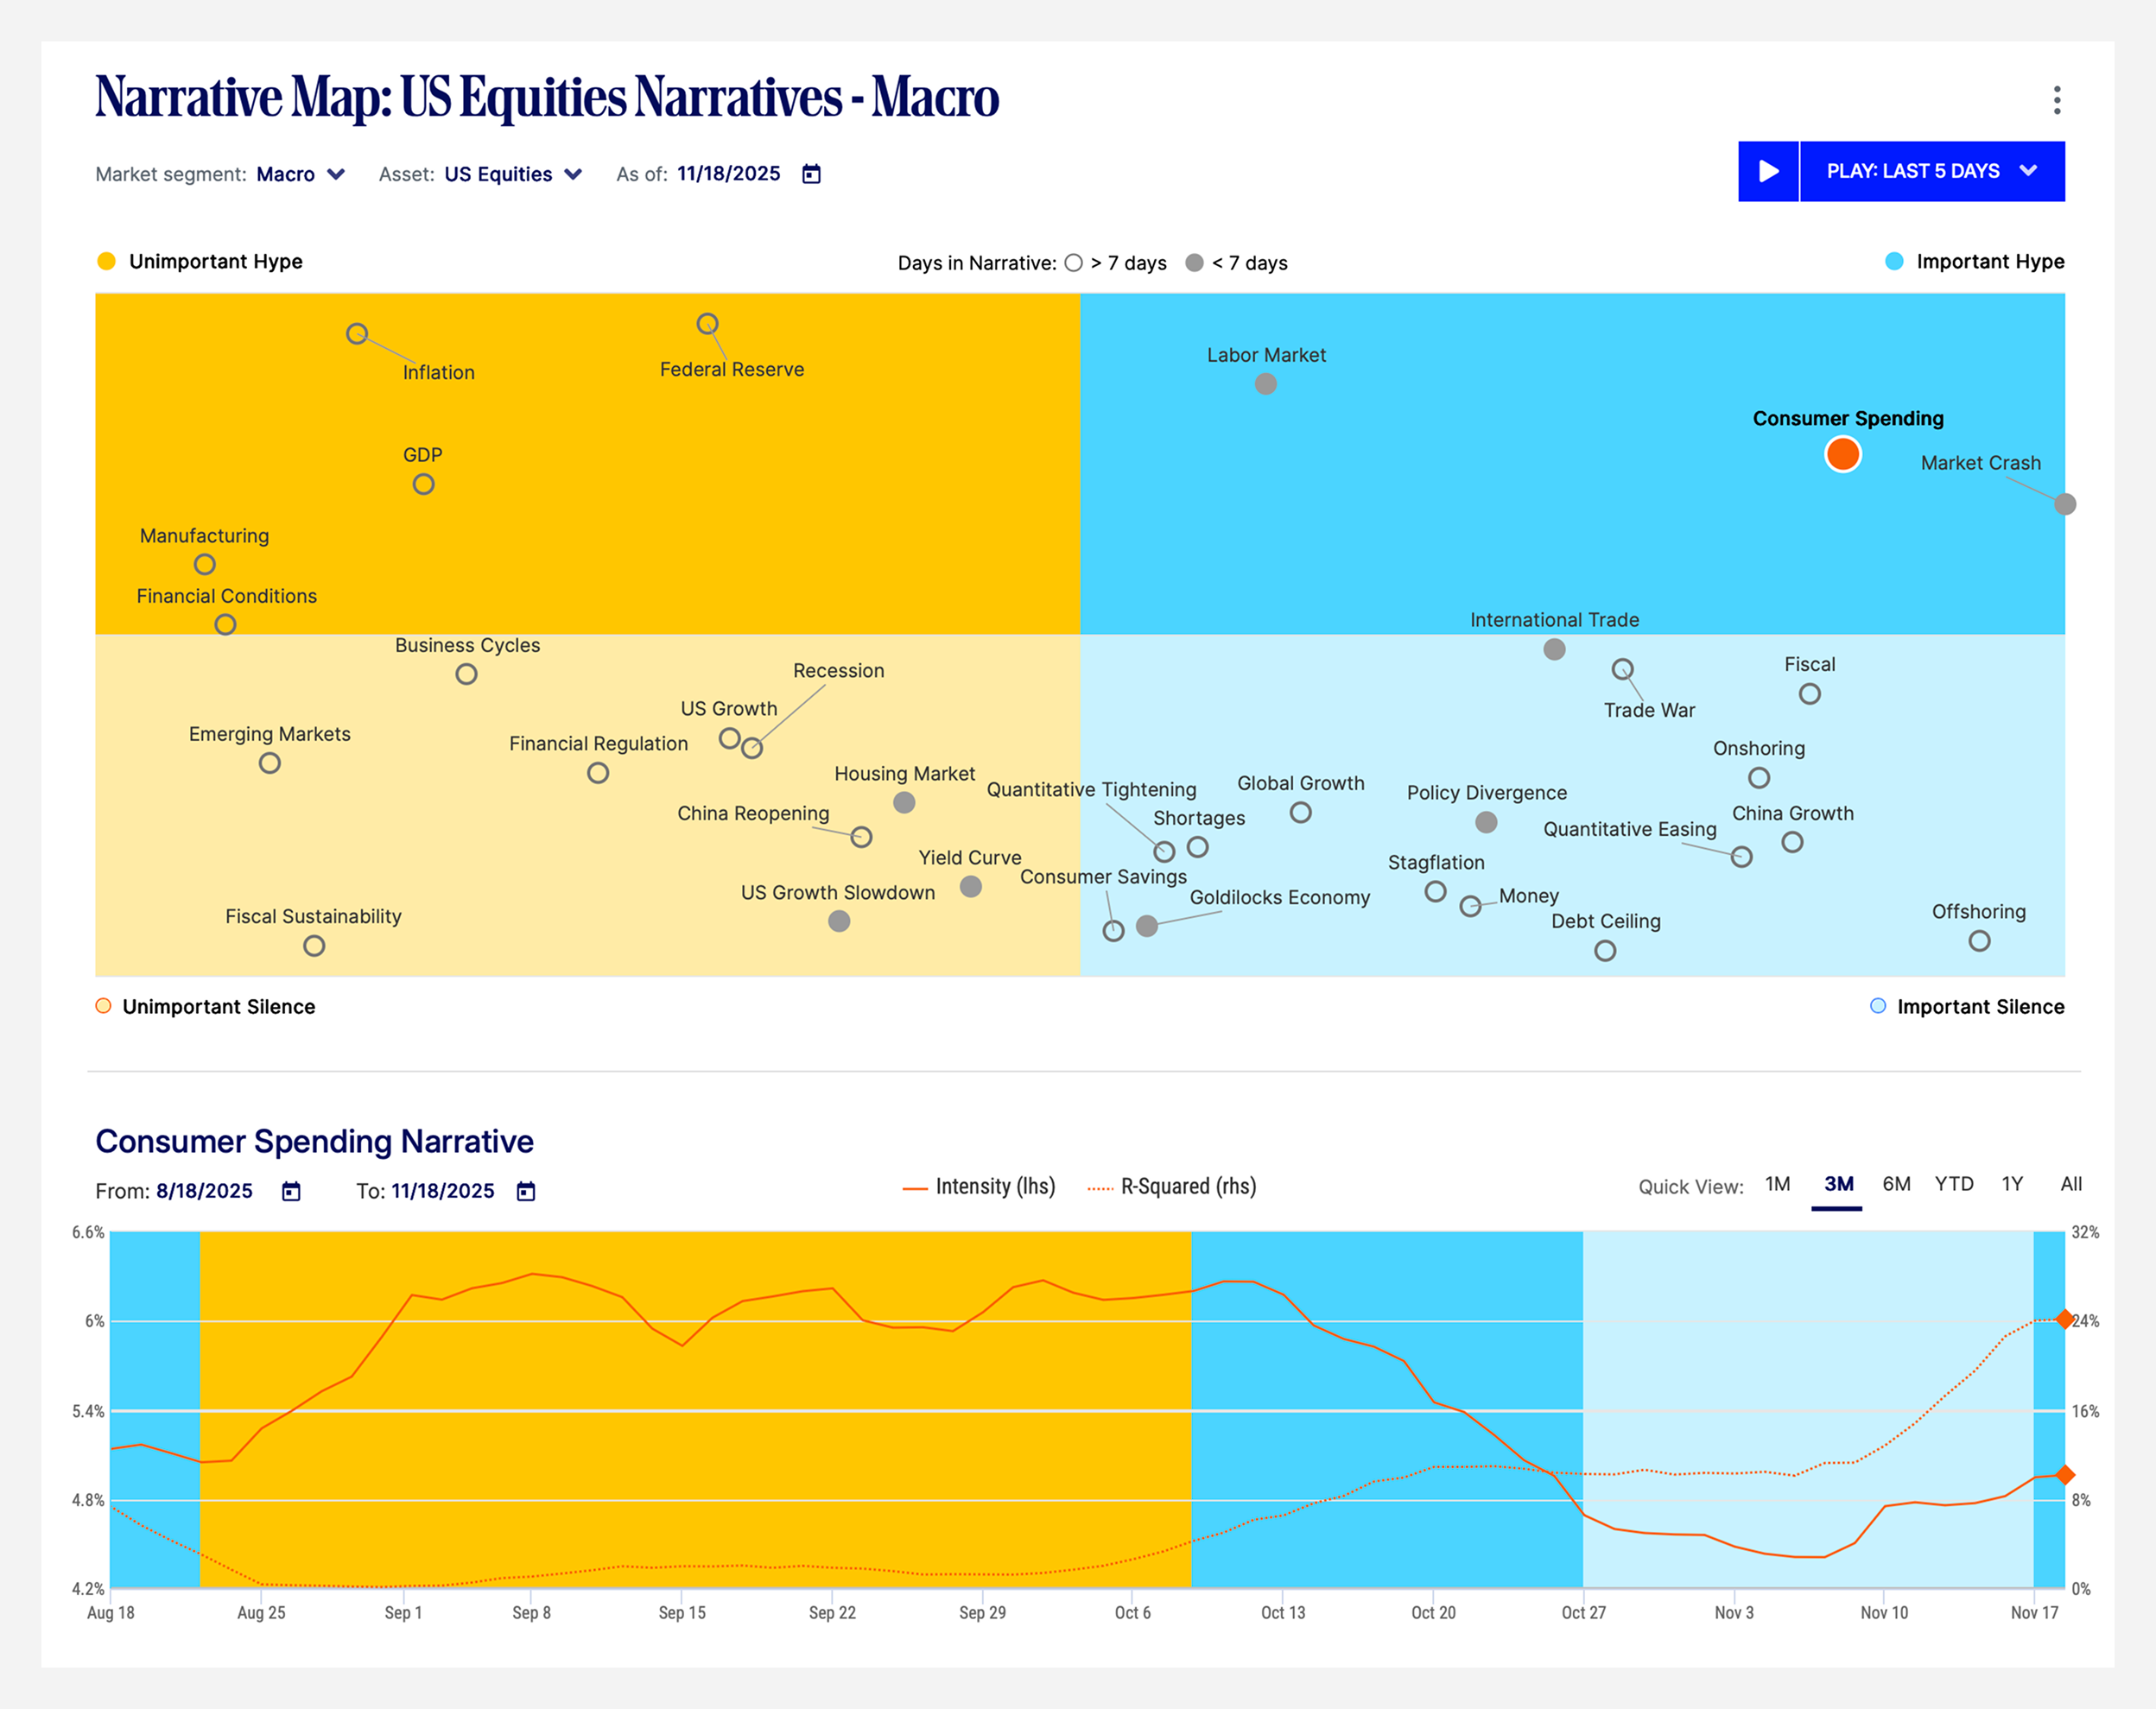
Our media analytics quantify central bank tone, market narratives, and sentiment intensity across asset classes using a large, curated universe of digital sources.
Hawkish versus dovish tone tracking to contextualize policy paths and surprises.
A structured view of evolving market themes—how stories cluster, spread, and shift—so you can tell when the narrative is turning and how much it’s driving markets.
Cross asset scores that capture direction and strength (including disagreement/dispersion) for currencies and equities.
Why it matters: Policy language and narrative momentum can move markets before fundamentals show up in prices. These indicators help you spot that inflection.
State Street PriceStats Indicators
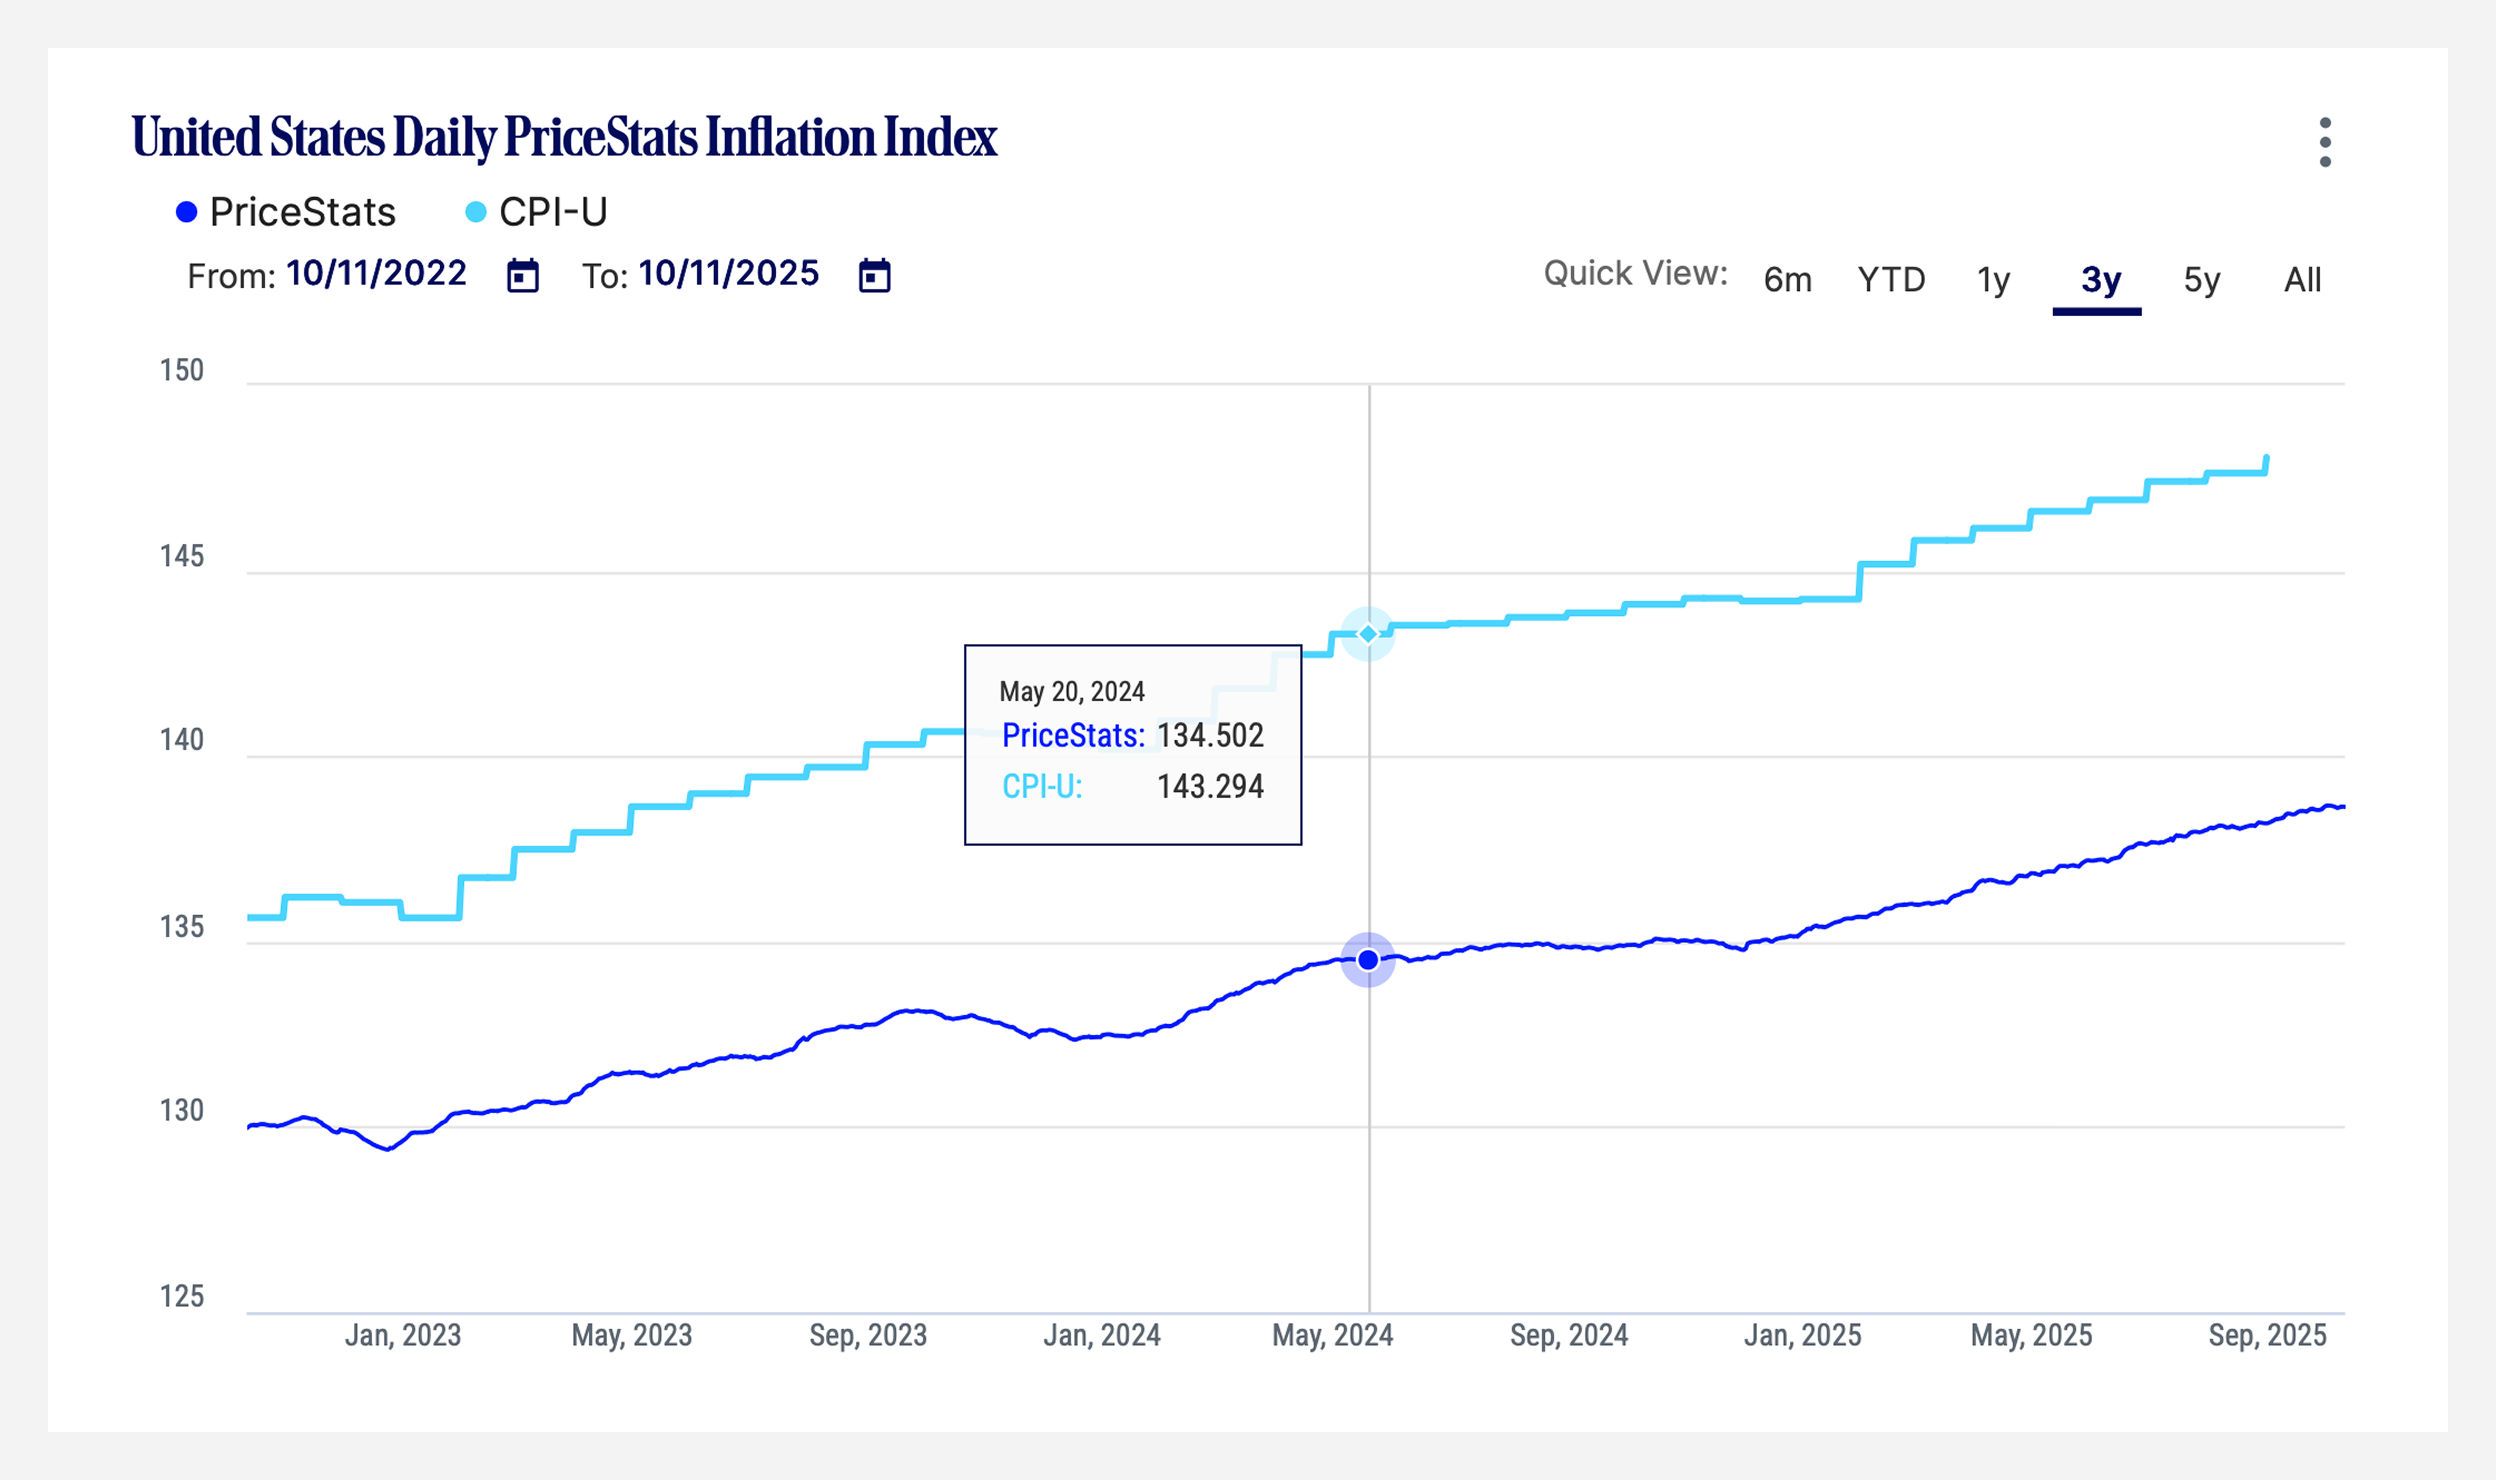
Monitor trends in near real-time using inflation and relative price signals based on millions of online prices from more than 20 countries.
High frequency inflation trends that complement official data, helping you anticipate policy and growth implications.
Currency valuation context grounded in relative price levels across countries.
Why it matters: Inflation and relative prices shape rates, FX, and risk premia; fresher reads give you an earlier line of sight.
Risk Indicators
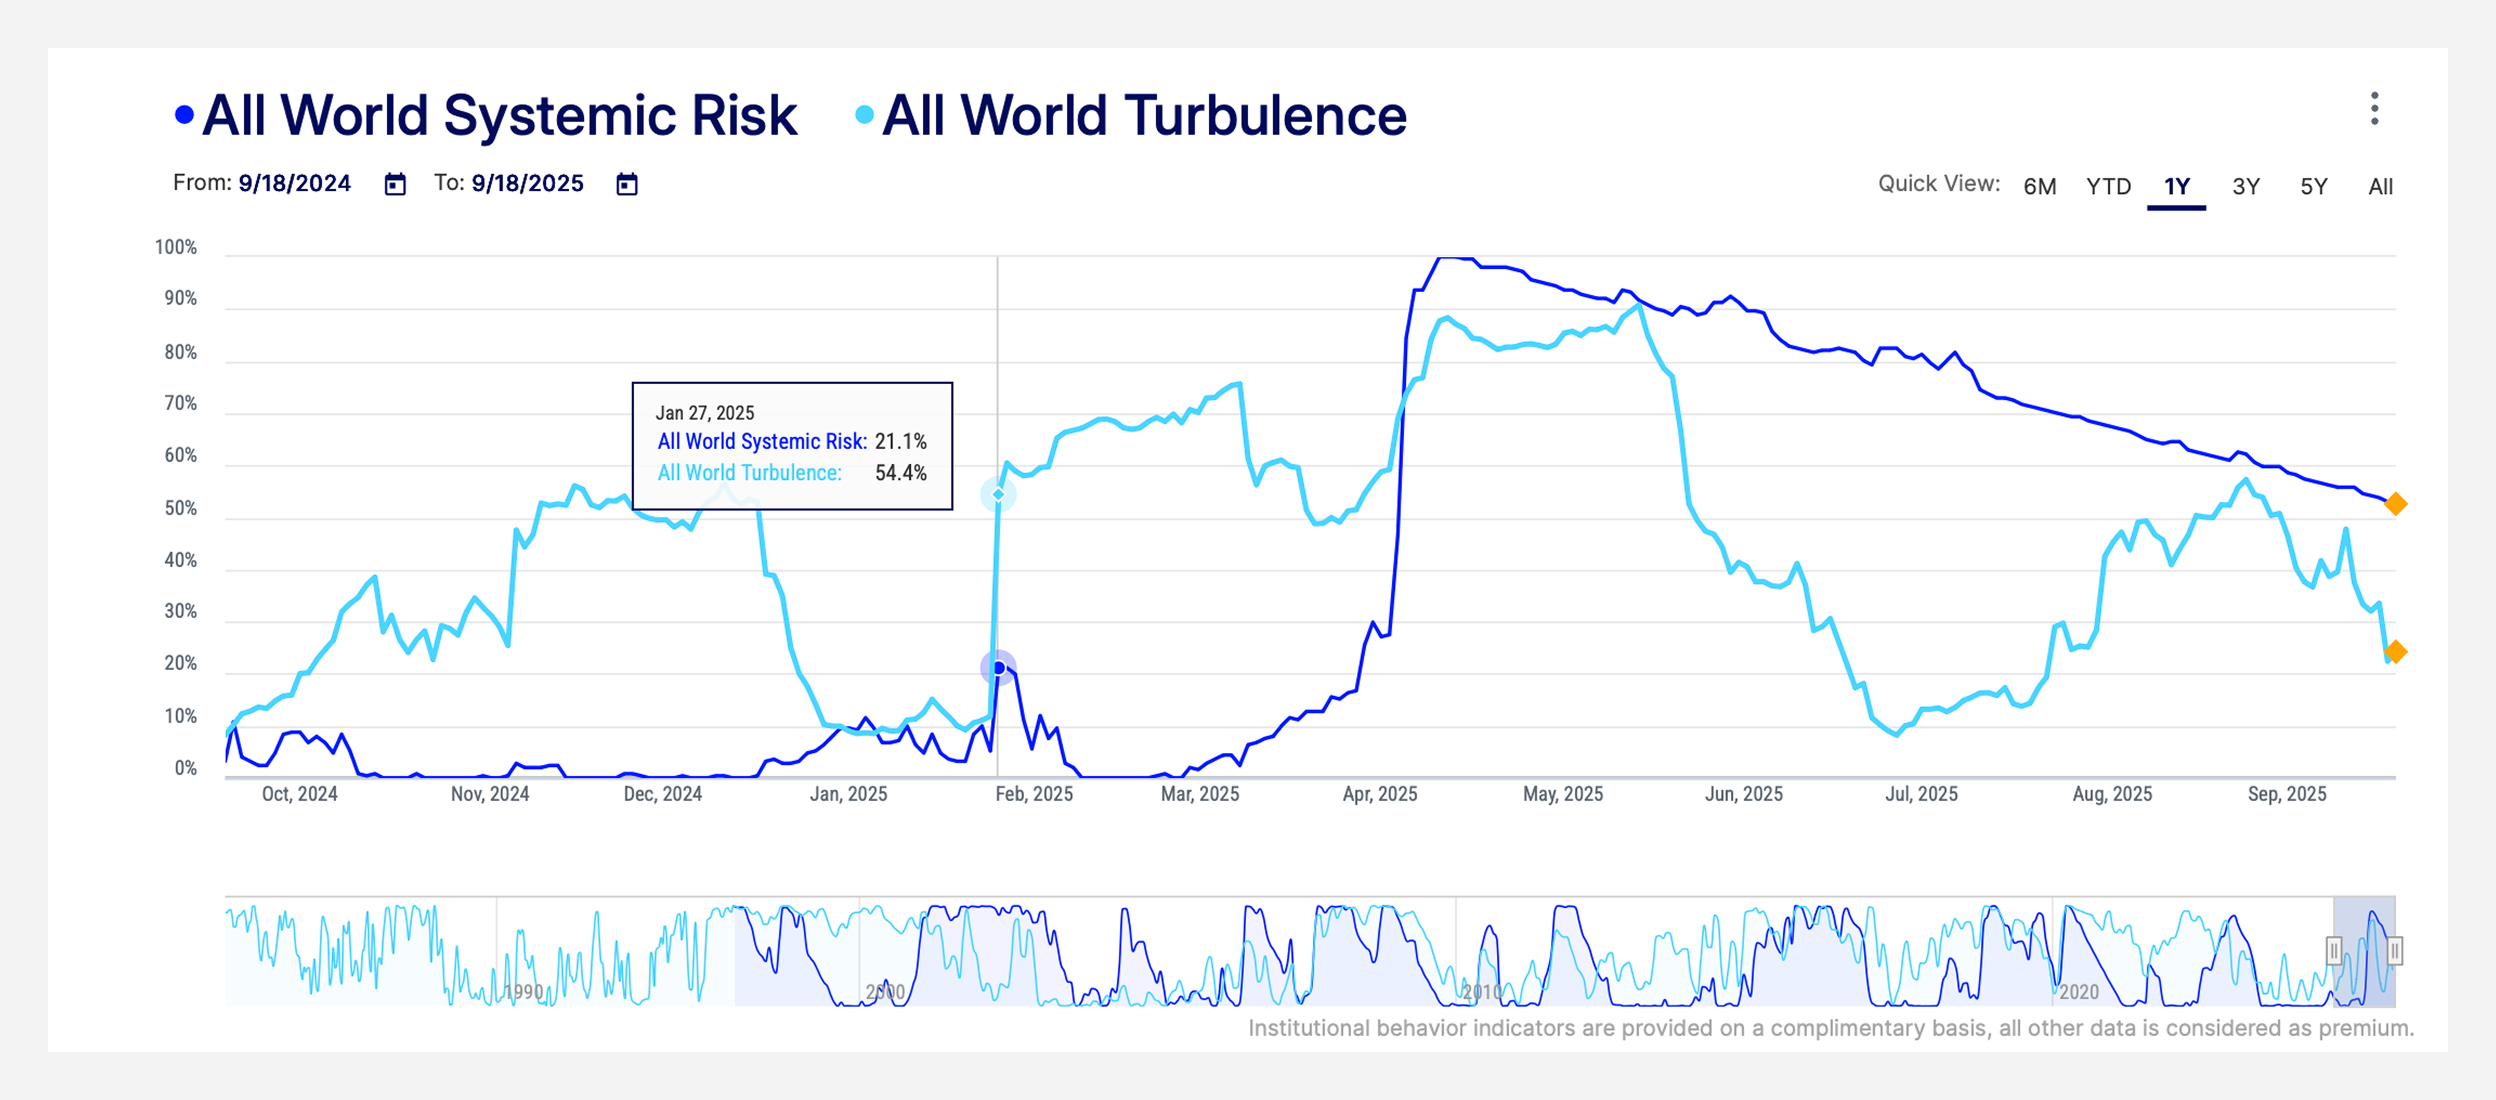
Distills complex, multivariate patterns into interpretable signals of stress, fragility, and drawdown risk.
How tightly coupled markets have become—higher absorption means fragility and greater contagion potential.
A price based measure of “joint unusualness” that flags volatility spikes and correlation breakdowns—conditions where risk premia tend to underperform.
Why it matters: Regimes change the payoff to almost every strategy; these indicators help you diagnose the state you’re in, and alert you to when they’re shifting.
1. Peter L. Bernstein Award for Best Article in an Institutional Investor Journal in 2013; Bernstein-Fabozzi/Jacobs-Levy Award for Outstanding Article in the Journal of Portfolio Management in 2006, 2009, 2011, 2013 (2), 2014, 2015, 2016, 2021; Graham & Dodd Scroll Award for article in the Financial Analysts Journal in 2002 and 2010. Roger F. Murray First Prize for Research Presented at the Q Group Conference in 2012, 2021, 2023. Harry M. Markowitz Award for Best Paper in the Journal of Investment Management in 2022, 2023. Doriot Award for Best Private Equity Research Paper in 2022.