Chart of the Week07 Jun 2024
Living on borrowed time
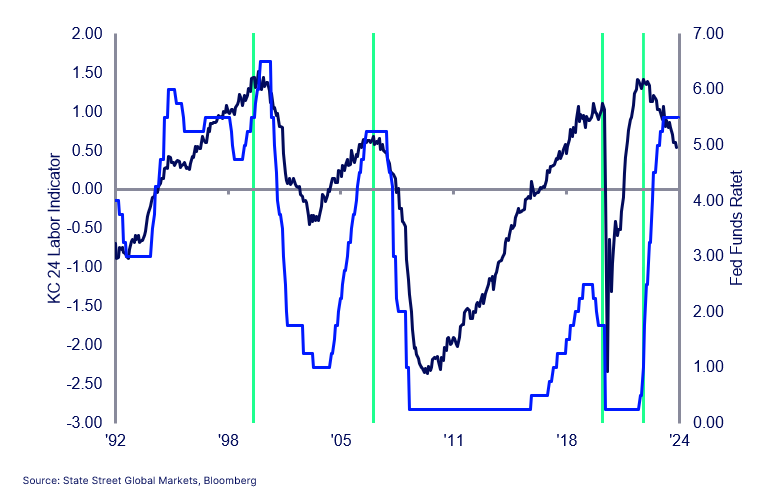
The message from Federal Reserve is that it would take several months of data to build sufficient confidence to begin the cutting cycle. Maybe or maybe not. The chart shows the evolution of the KC Labor indicator that has 24 variables. A glance at the historical record shows that the first-rate cut does not occur until this indicator has declined for many months. The exception was of course the pandemic.
There is no doubt that the inflation risk has played a much larger part in policymaker calculus. Yet, this labor indicator topped out 24 months ago. In 2001 the first rate cut came after a 12-month decline. It is nearly twice that long this time.