By Mark Kritzman, Ding Li, Grace (Tiantian) Qiu, and David Turkington.
Published in the Financial Analysts Journal, December 2020.
We show why mapping sequences of economic outcomes leads to a richer understanding of scenarios, probabilities and portfolio returns.
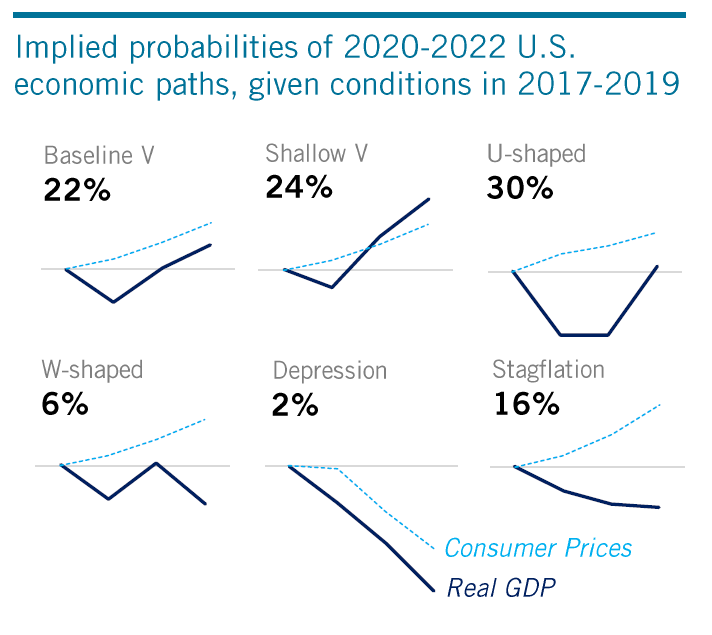
Conventional methods of scenario analysis are often oversimplified, focusing only on outcomes and ignoring what happens along the way. We propose that investors define scenarios as paths of economic variables, which are compared to past episodes in history using a statistic called the Mahalanobis distance. We apply this methodology to hypothetical economic trajectories for 2020 and beyond – such as V- or W-shaped recessions, depression and stagflation – to see what 90 years of history imply for the performance of stocks and bonds in the United States.


