Solutions
Reporting
The Reporting module is a robust decision support tool that goes beyond summary statistics, offering comprehensive reporting capabilities based on accurate, complete and unbiased data from the investors (LPs) processed by State Street custodial and accounting services. Reporting results provide valuable insights into private capital market performance, trends and liquidity, and empower subscribers to make more informed investment decisions.
Reporting subscribers can access such metrics as:
- Index composition details
- Fund sizes by vintage year
- Since-inception internal rates of return (IRRs) and multi-period horizon IRRs (1-, 3-, 5-, 10-year, and since inception)
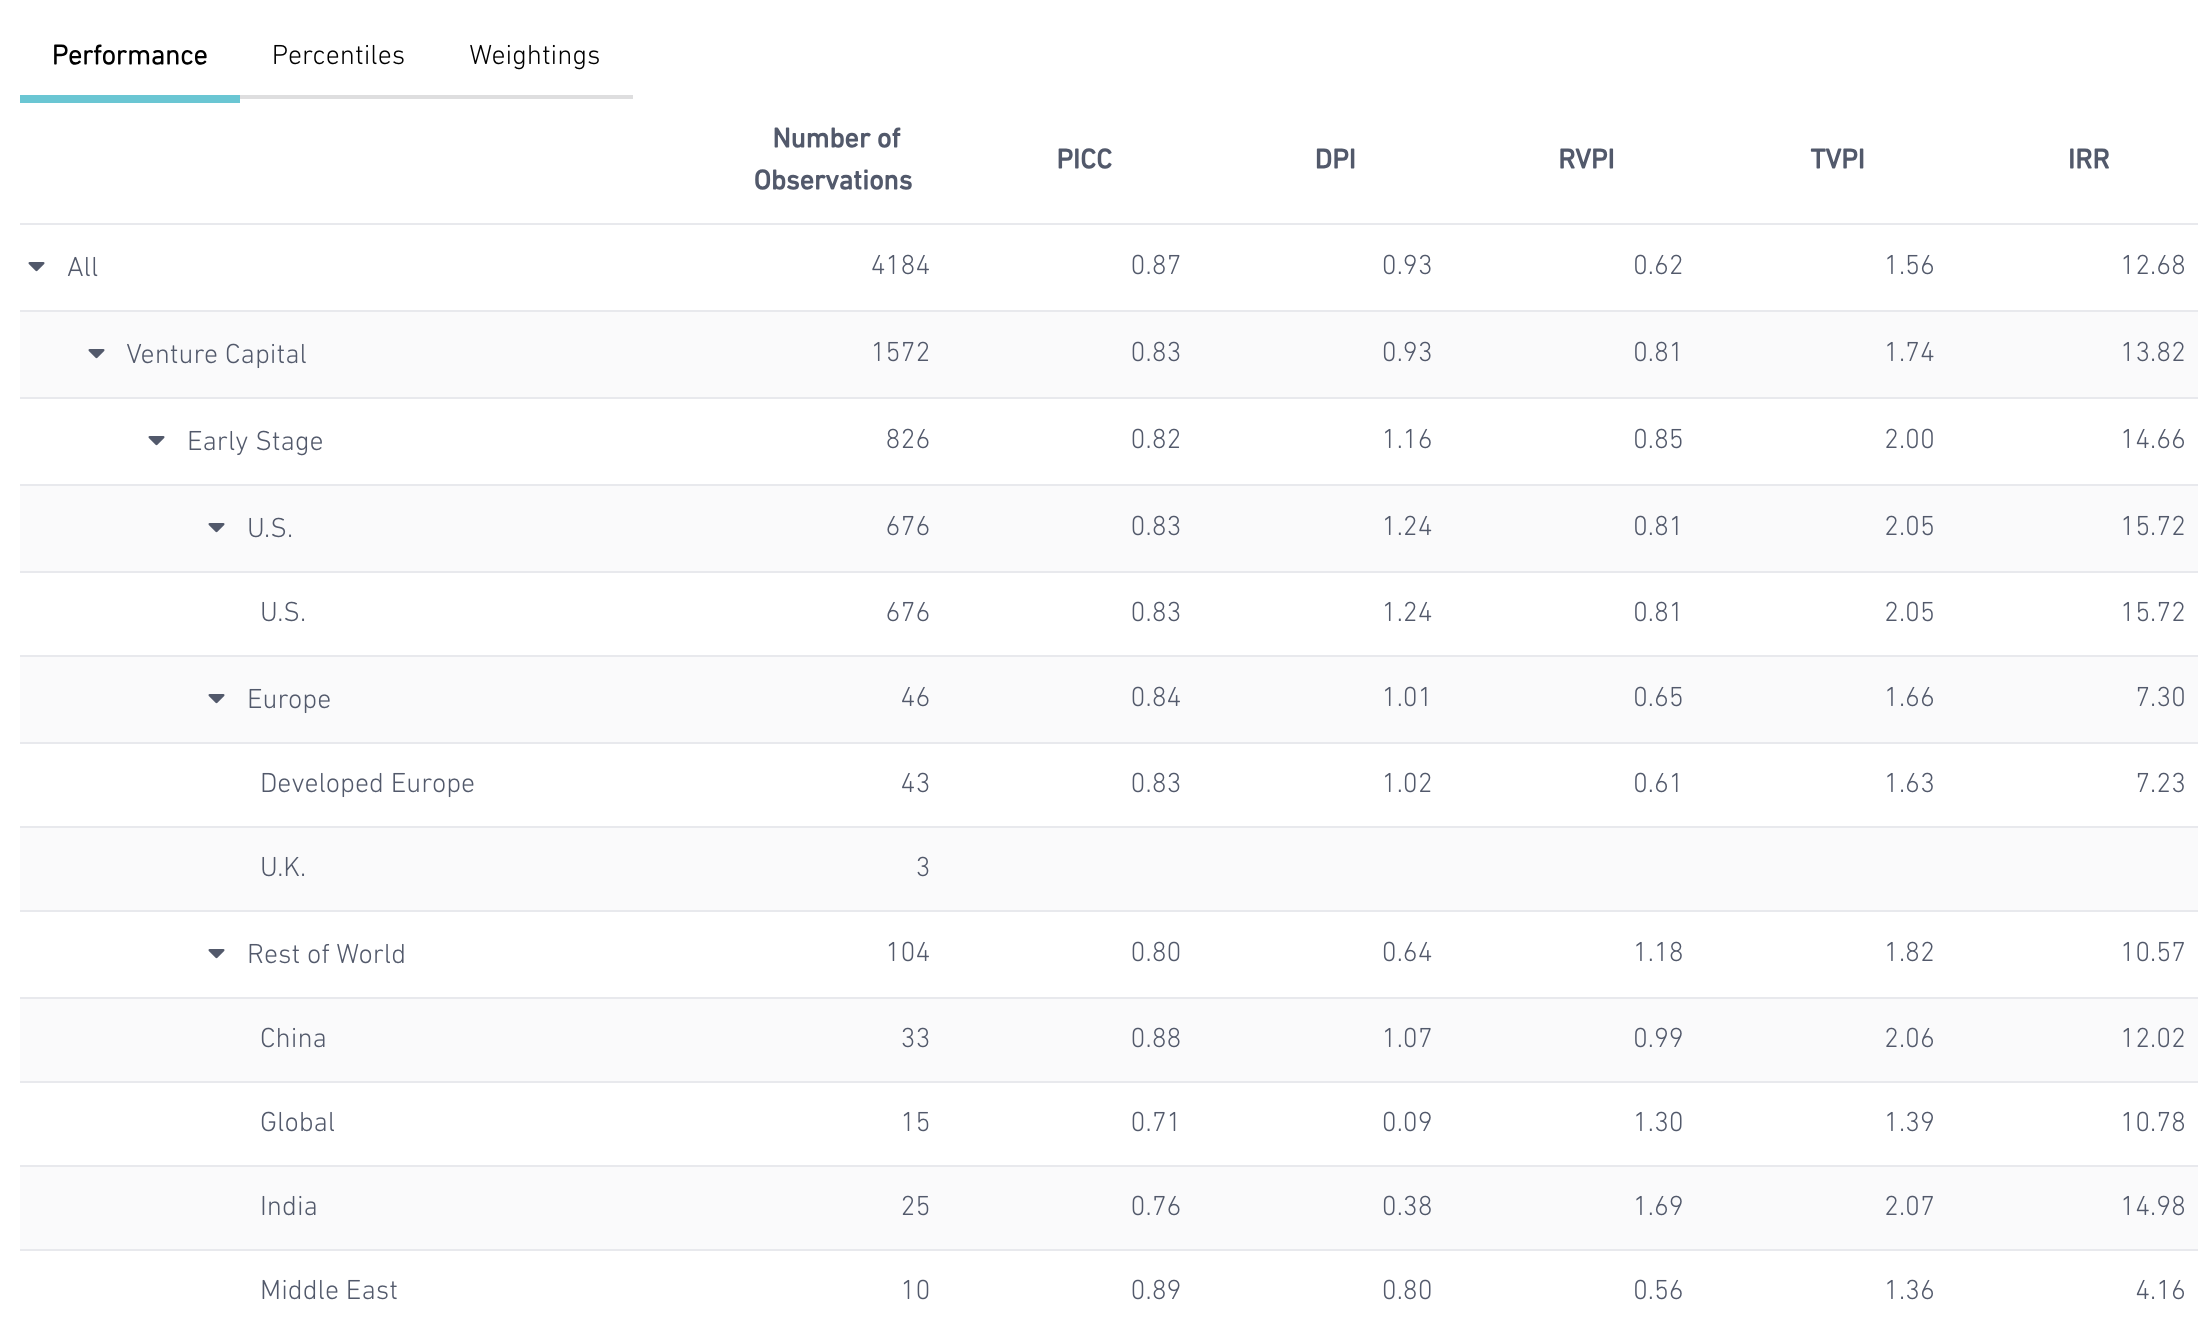
- Quartile analysis by vintage year, strategy, sub-strategy and region
- Dry Powder analysis including contributed capital, unfunded commitment, and cumulative dry powder by vintage year
- Activity ratios including monthly paid-in capital to total commitment (PICC), distributions to paid-in capital (DPI), residual value to paid-in capital (RVPI), total value to paid-in capital (TVPI)
Release Schedule
- State Street Private Capital Index is published 100-105 days after quarter ends for Q1-Q3, and 130-135 days after Q4, with 97%-99% of GP reported valuations.
- Preliminary index returns are calculated 90 days after quarter ends, when approximately 60-70% of the number of active funds whose NAVs have been updated.
SSPCI Horizon Returns : Q1 2026
Preliminary Quarterly Returns : Q1 2026
Custom Benchmarking
Recognizing that every client and portfolio is unique, State Street offers custom benchmarking solutions for both GPs and LPs , supporting even the most complex and sophisticated portfolios. Subscribers can compare the performance of their investments to peers using a comprehensive suite of analytics.
Custom Benchmarking Features
- Access to performance metrics such as IRR, Modified Dietz, TVPI, DPI, etc. and quartile analysis, across any combination of vintage year, strategy, sub-strategy, sector focus, region, country, fund size, and other characteristics
- Full flexibility to choose any historical point-in-time dataset and any investment horizon for performance calculation
- Ability to rescale commitment allocation of custom benchmarks to match portfolio commitment weights, isolating manager selection effects from asset allocation impacts
- Public Market Equivalent (PME) calculations to simulate investing custom benchmark cash flows in any public market proxy
- Ability to save and subscribe to user-defined custom benchmarks
- API for large-scale programmatic configuration and computation
Indices
The State Street Private Capital Indices are predefined benchmark series measuring the aggregate performance of private capital funds across a comprehensive range of asset classes, strategies and geographics. These indexes deliver insights designed to more consistently measure portfolio time-varying risk and performance across private capital investments.
Index Highlights
- Covering buyout, venture capital and private debt, with a wide range of sub-strategies and geographies
- Returns calculated quarterly using pooled horizon IRR and Modified Dietz
- Long-term historical series dating back to the 1990s
SSPCI Quarterly Return Time Series
Additional Capabilities
Holdings Insights
Gain a deeper understanding of how private capital is deployed at the underlying asset level. Our platform visualizes net asset value and remaining cost exposures across fund‑level dimensions, including strategy, sub‑strategy, region, and sector, as well as portfolio company‑level dimensions such as industry, sector, and geography. Explore where value is created, how exposures evolve and gain a clear, granular view of private market dynamics.
J-curve Analytics
Leveraging precise and comprehensive cash flow and valuation data from State Street, our J-curve analytics offers dynamic visualizations of how fund contributions, distributions, net asset value, and unfunded commitments evolve over time. Users can explore 25th, median, and 75th percentile trajectories across fully customizable dimensions—including strategy, vintage year, and region—gaining deep insights tailored to their needs. This module delivers a transparent, data-driven perspective on the progression of private capital performance, illuminating trends and patterns as they unfold across business cycles and investment strategies throughout the entire fund life span.
FX Module
Seamlessly integrated within the Custom Index interface, this module empowers users to analyze private capital index exposures and performance across fund local currencies, alongside a broad array of fund characteristics. It offers hypothetical NAV-based FX-hedged index results with a customizable hedge ratio, enabling users to isolate genuine private market returns by minimizing currency effects. Additionally, users can forward-adjust FX impacts on index NAVs by one quarter, ensuring performance alignment with their accounting book of record for enhanced comparability.